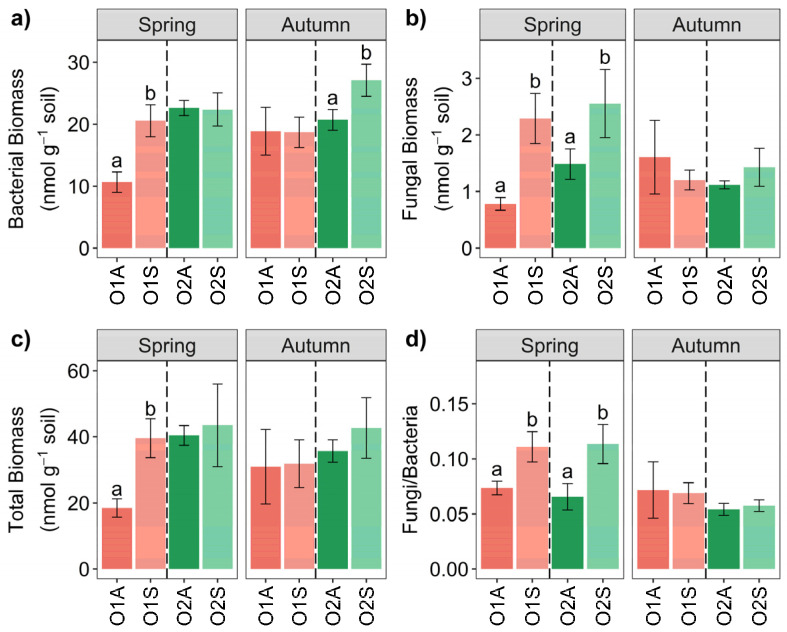
Figure 5.
Bar chart of biomass abundance (nmol g−1 soil h−1) divided into Bacteria (a), Fungi (b), Gram- Total Biomass (c), Fungi/Bacteria ratio (d), of Orchard 1 and 2 in Spring and Autumn. Different letters (a, b) indicate significant differences based on One-Way ANOVA results at p < 0.05. Error bars represent the standard error of the mean (4 replicates).

