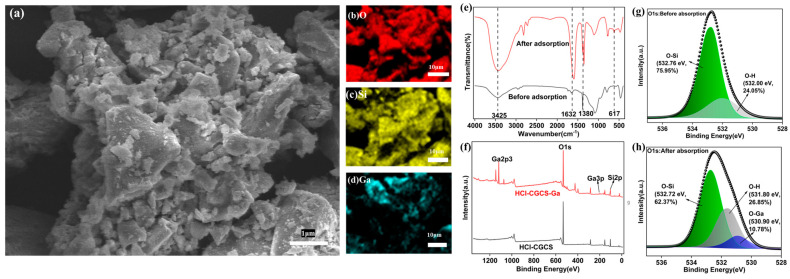
Figure 8.
SEM Images of HCl-CGCS after Ga(III) adsorption (a); elemental distribution EDS maps of (b) O, (c) Si, and (d) Ga; FTIR spectra before and after Ga adsorption (e); XPS survey spectrum (f); O1s fine spectrum of HCl-CGCS before Ga adsorption (g); and O1s fine spectrum of HCl-CGCS after Ga adsorption (h).

