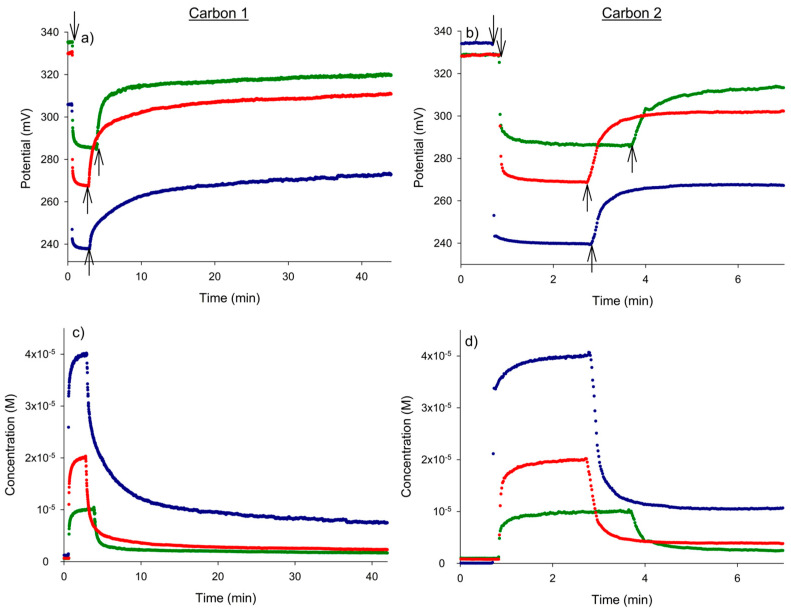
Figure 3.
The dynamic potential responses (a,b) and corresponding nitrate concentration vs. time plots (c,d) obtained for the nitrate removal process with activated carbons 1 and 2 for three initial nitrate concentrations, 1 × 10⁻⁵ (green), 2 × 10⁻⁵ (red) and 4 × 10⁻⁵ M (blue). The first and second arrows in Figure 2a,b correspond to the addition of nitrate and activated carbon, respectively.

