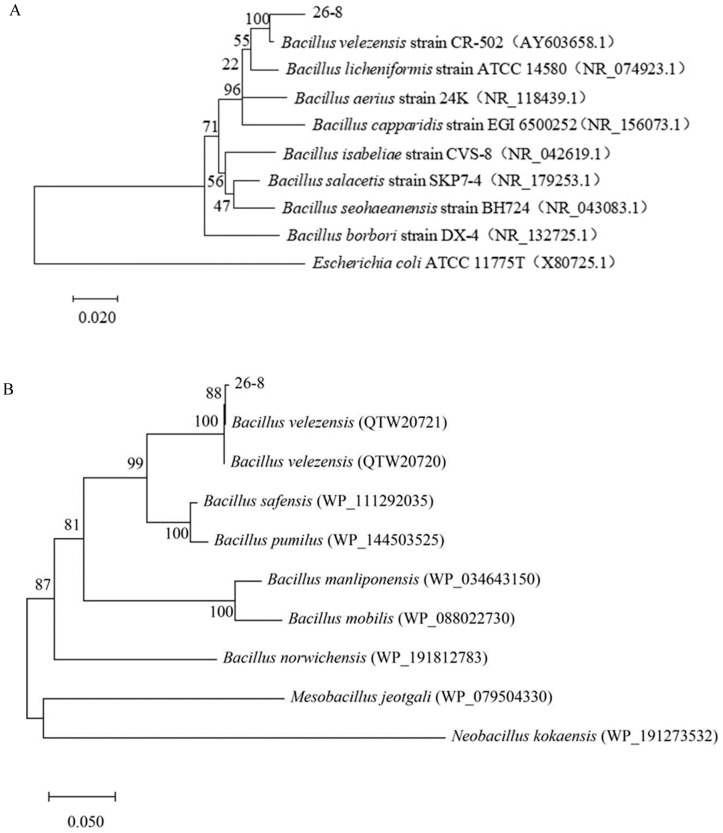
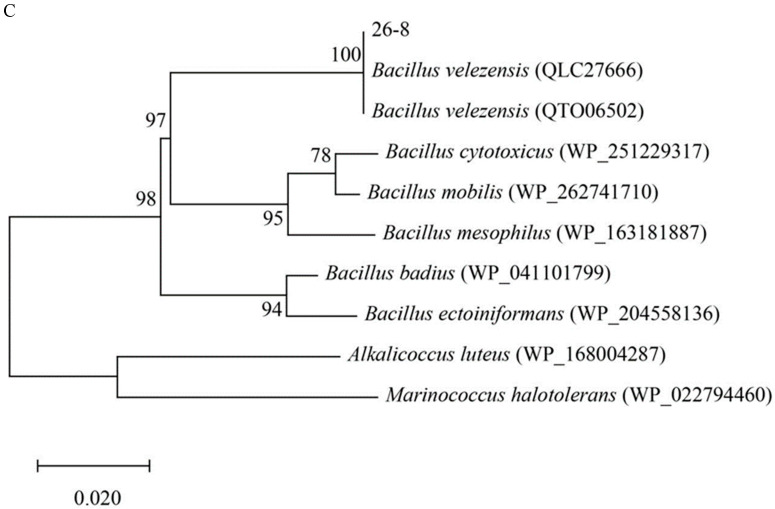
Figure 4.
Phylogenetic tree based on 16S rDNA (A), gyrB (B), rpoB and (C) gene sequence. Branch termini are tagged in light of isolate species and GenBank accession numbers. The numbers above (or below) the nodes show the bootstrap values (50%) occurring after 1000 replications. Scale bars represent the average number of nucleotide substitutions per site.


