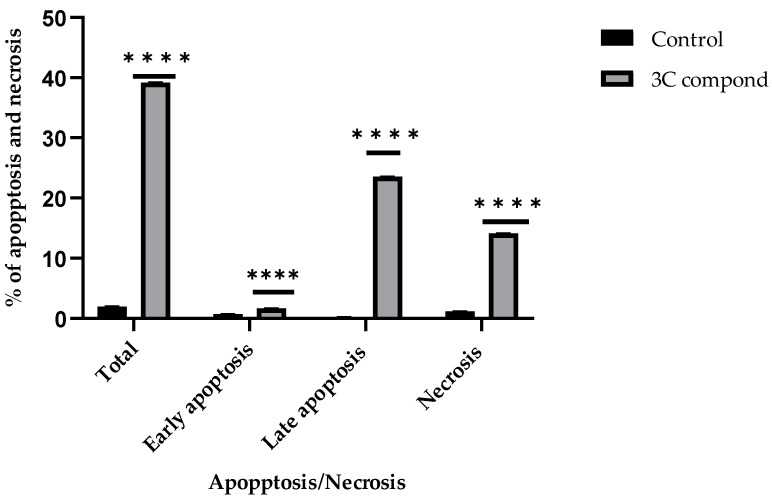
Figure 5.
The percentages of early apoptosis, late apoptosis, total apoptosis, and necrosis induced by the IC50 concentration of the CP derivative in comparison to the untreated control on HCT-116 colon cancer cells. Bars represent the mean ± SD. Statistical significance was determined using a two-way ANOVA test and the Tukey–Kramer test afterward, with **** p < 0.0001 indicating a significant difference compared to the control group.

