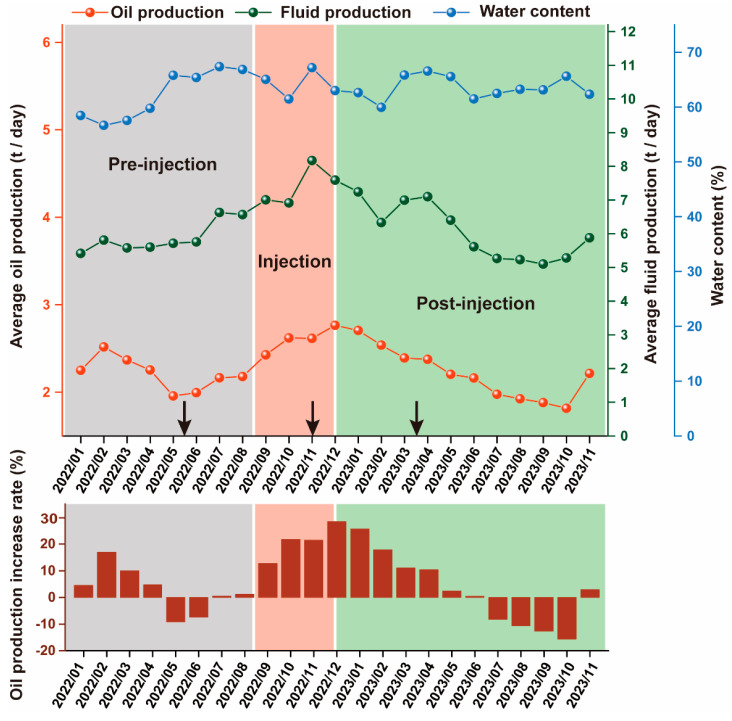
Figure 6.
Production performance and oil production increase rates in the field trial. The arrows represent sampling dates. Gray coding indicates the pre-injection phase, red coding indicates the injection phase, and green coding indicates the post-injection phase. The pre-injection, injection, and post-injection phases together constitute the complete MEOR experimental cycle.

