Figure 5.
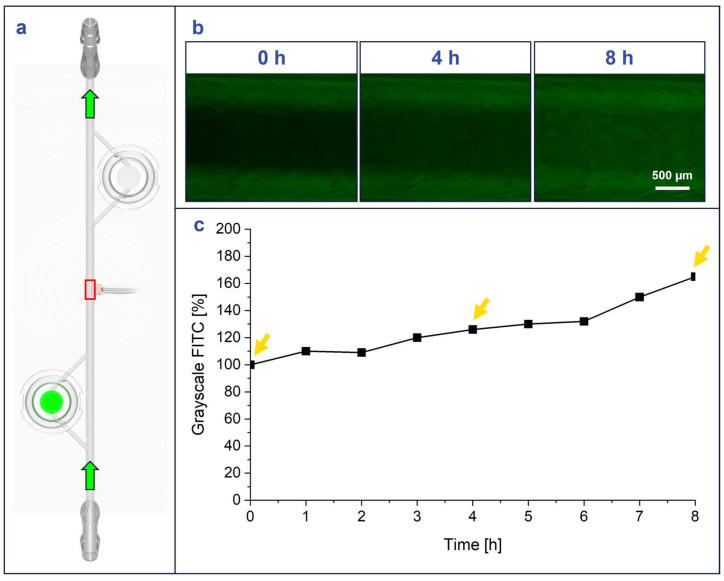
FITC-dextran flow from FITC-dextran laden CANA module shows increasing fluorescence in MiFD over time. (a) Position of FITC-dextran module (green disc) and measurement point on the device (red square), green arrows: flow direction. (b) Intensity-adjusted images in the main channel of the device at different time points (green fluorescence channel images). (c) Indexed grayscale values for the green channel (FITC) of images, yellow arrows indicating imaging time points in 5b.

