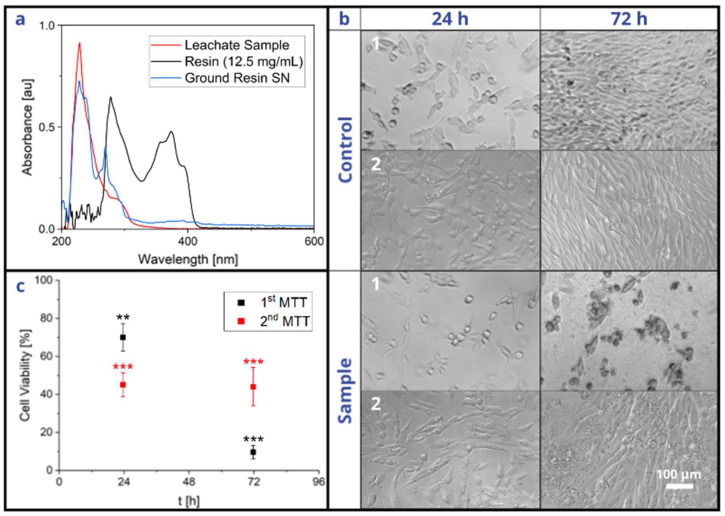
Figure 7.
Leachate testing of the MiFD and its cytotoxicity. (a) Comparison of absorbances between a leachate sample, liquid resin, and supernatant from ground, printed resin. (b-1) Optical microscopy images of leachate-treated and untreated NIH/3T3 cells from a standard device. (b-2) Optical microscopy images of leachate-treated and untreated NIH/3T3 cells from an additionally washed device. (c) Viability of leachate-treated cells compared to controls from both standard and washed devices. Leachate extraction as described in the materials and methods section. Statistics with n = 3 each, ** p < 0.01; *** p < 0.001 significant differences between treated and untreated conditions at the same time point in a Student’s t-test.

