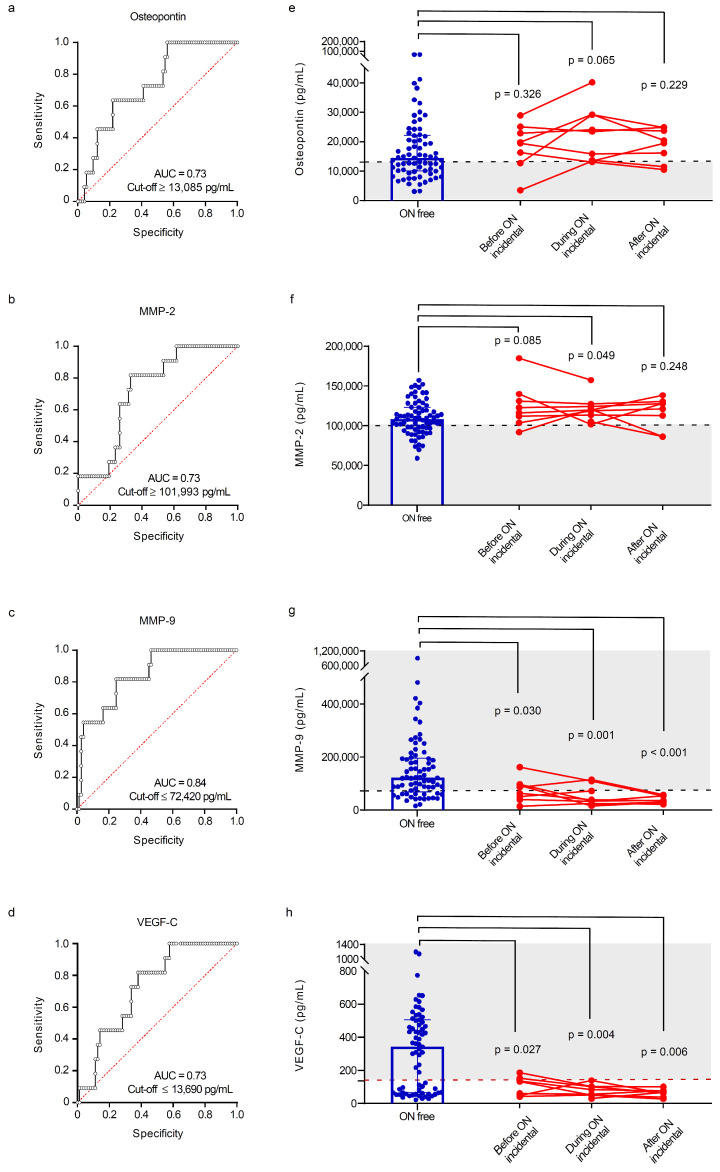
Figure 5.
Accuracy of bone and angiogenesis biomarkers in predicting osteonecrosis in Gaucher disease patients. ROC curve analysis with area under the curve, sensitivity and specificity of (a) osteopontin, (b) MMP-2, (c) MMP-9 and (d) VEGF-C in the prediction of osteonecrosis. Cut-offs for (e) osteopontin, (f) MMP-2, (g) MMP-9 and (h) VEGF-C in patients who remained free from osteonecrosis and those who sustained osteonecrosis during follow-up. For each marker, individual values are shown before, during and after the event. AUC = area under the curve; MMP = matrix metalloproteinase; ON = osteonecrosis; VEGF-C = vascular endothelial growth factor C. (●) Osteonecrosis-free; (●) incident osteonecrosis.

