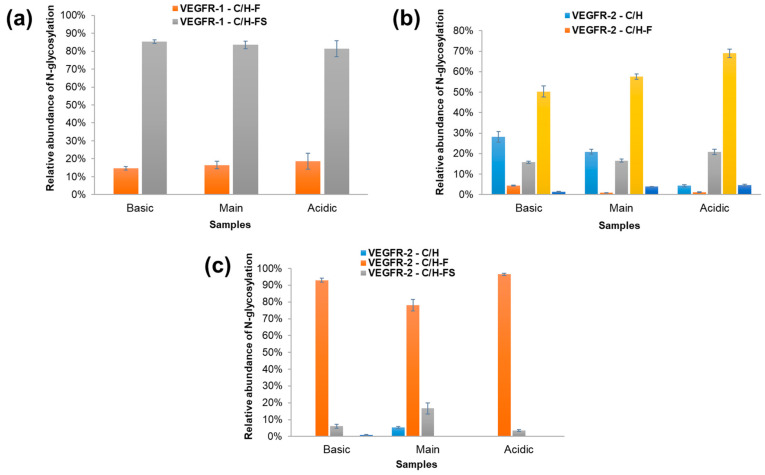
Figure 4.
A comparison of the different N-glycoforms in the (a) VEGFR-1, (b) VEGFR-2, and (c) IgG domains across the three samples: basic, main, and acidic. The different glycoforms are represented by different colors in the bar chart. Blue (VEGFR-1-C/H), yellow (VEGFR-1-C/H-F), green (VEGFR-1-C/H-FS), pink (VEGFR-1-C/H-S), and purple (VEGFR-1-HM).

