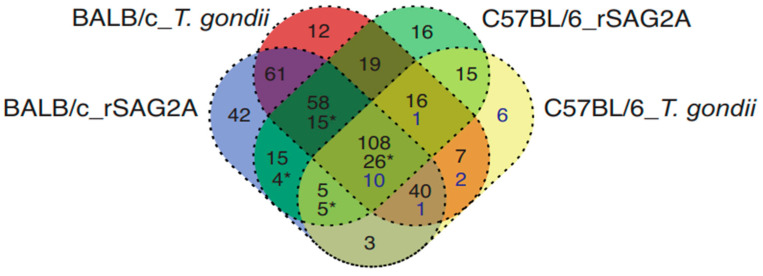
Figure 3.
Venn diagram of proteins shared by PECs of mice infected with T. gondii or treated with rSAG2A. Venn diagram showing the number of proteins in common and not in common between the different groups. PECs of the BALB/c mice treated with rSAG2A (BALB/c_rSAG2A), BALB/c mice infected with T. gondii (BALB/c_T. gondii), C57BL/6 mice treated with rSAG2A (C57BL/6_rSAG2A), and C57BL/6 mice infected with T. gondii (C57BL/6_T. gondii). The asterisk values represent proteins augmented with fold change > 2 exclusively in PECs of C57BL/6 mice treated with rSAG2A.

