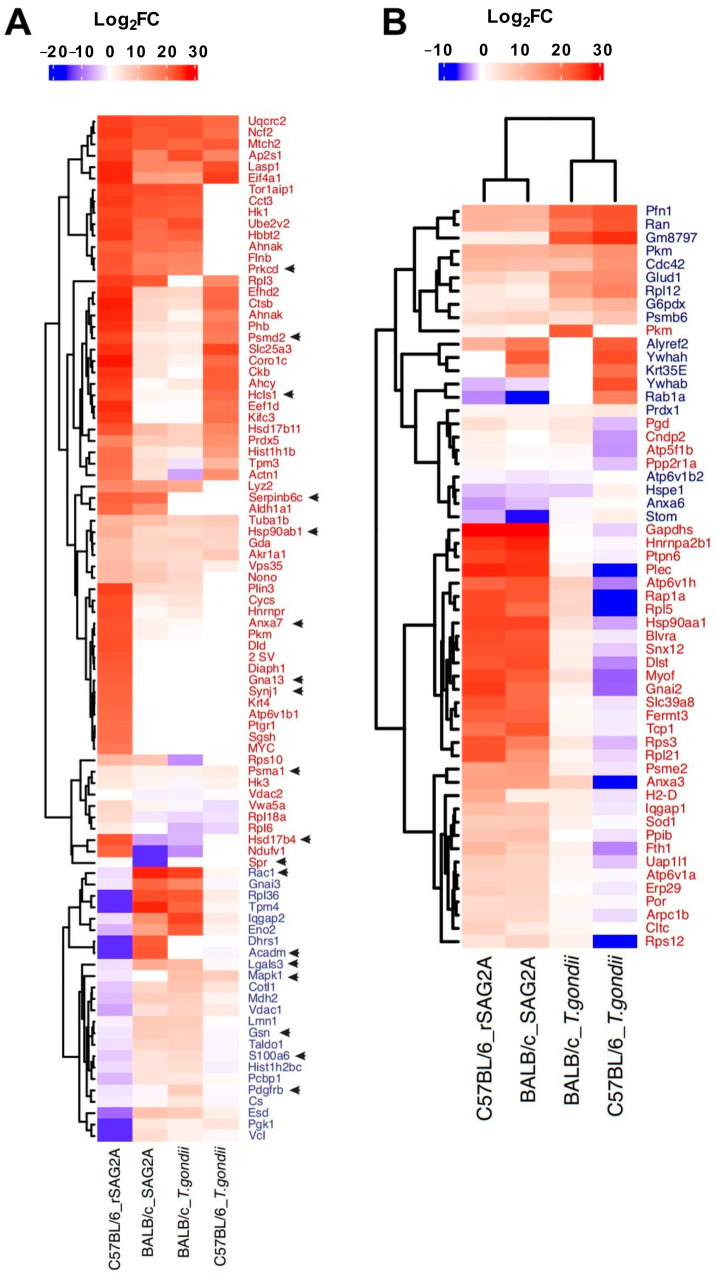
Figure 4.
Accumulation profile and hierarchical clustering for exclusive/up-modulated or down-modulated proteins in C57BL/6 mice PECs treated with rSAG2A (A) or infected with T. gondii (B), compared to BALB/c PECs in the same conditions. Proteins in red are those exclusive or that had a Log2FC (compared to the other conditions) at least twice as high in C57BL/6 PECs treated with rSAG2A (red names in A) or in C57BL/6 PECs infected with T. gondii (red names in B). Proteins in blue are those that were repressed only in C57BL/6 PECs treated with rSAG2A (blue names in A) or in C57BL/6 PECs infected with T. gondii (blue names in B). Heatmap colors are represented by Log2FC scale, which indicates the accumulation of proteins in Log2 fold change scale; blue shades indicate the repressed proteins and red shades indicate proteins that increased in relation to their respective controls. Black arrows represent proteins present in the cytokine network.

