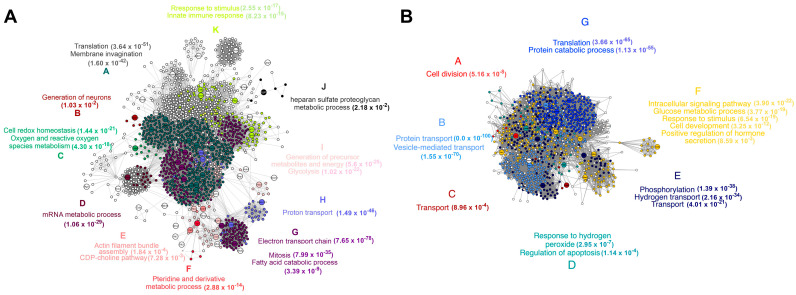
Figure 6.
Network of protein–protein interactions for down-modulated proteins in PECs of C57BL/6 mice treated with rSAG2A (A) or infected with T. gondii (B). The bigger nodes represent the proteins identified through proteomic analysis. Smaller nodes were aggregated with networks using the STRING database. The different colors represent different clusters identified in the module analysis. The biological processes enriched in each cluster are described with the respective colors around the networks.

