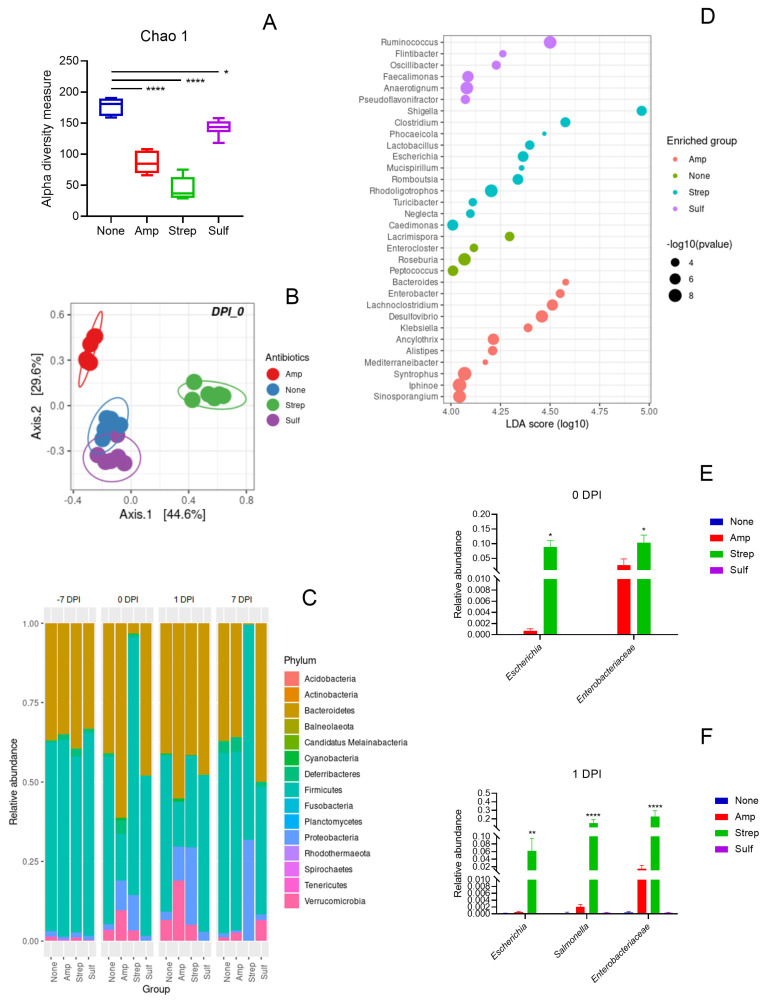
Figure 4.
Analysis of the mouse gut microbiomes using 16S rRNA gene amplicon sequencing. (A) microbial species richness assessed by the Chao1 index on 0 days post-infection (DPI) following various antibiotic pre-treatments: None (no antibiotic, blue), Amp (ampicillin, red), Strep (streptomycin, green), and Sulf (sulfamethazine, purple), with statistical significance denoted by asterisks (* p < 0.05, **** p < 0.0001). (B) Principal coordinate analysis (PCoA) based on the Bray–Curtis dissimilarity of the gut microbiomes on 0 DPI, with colors indicating different antibiotic treatments. (C) Bar graph showing the mean relative abundance of microbial phyla from −7 to 7 DPI across different treatment groups. (D) Dot plot illustrating the differential enrichment of various genera on 0 DPI, with dot size representing the negative logarithm of the p-value and color indicating the antibiotic treatment group. (E,F) Relative abundance of Enterobacteriaceae on 0 (E) and 1 (F) DPI, with bars representing the mean values and error bars indicating standard error (SE). Statistical significance in panels (E,F) is indicated by asterisks above the bars (* p < 0.05, ** p < 0.01, **** p < 0.0001).

