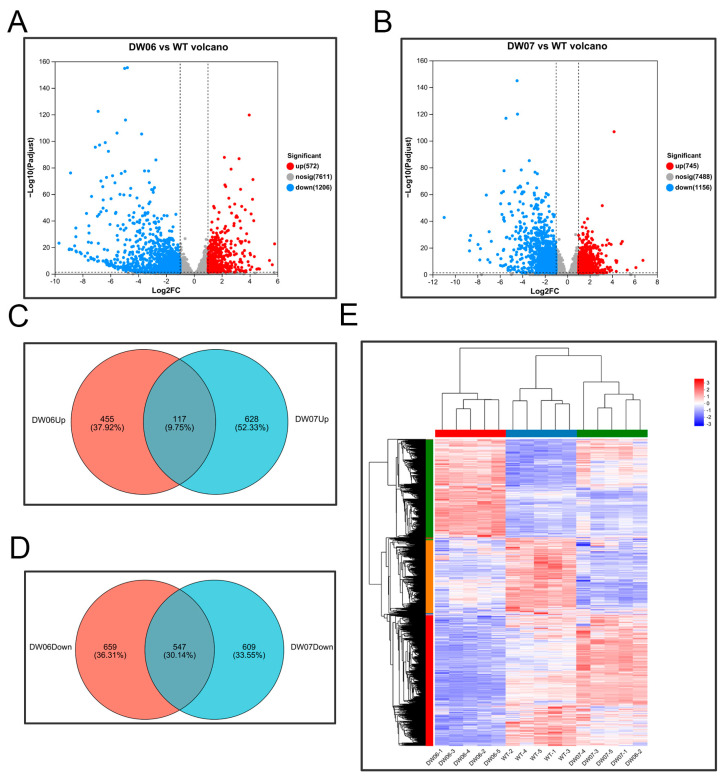
Figure 3.
Overview of differentially expressed genes (DEGs) between two UV-induced mutants and wild-type. (A,B) Volcano plots of DEGs (P.adj < 0.05, |log2FC| ≥ 1) between DW06 vs. WT and DW07 vs. WT. (C,D) Venn diagrams of upregulated DEGs (C) and downregulated DEGs (D) in the two gene sets. The orange and blue circles represent the two genomes (DW06 vs. WT, DW07 vs. WT), respectively. (E) Heatmap of clustering analysis. Each column represents a sample, and each row represents a gene. The normalized gene expression values are represented in different colors.

