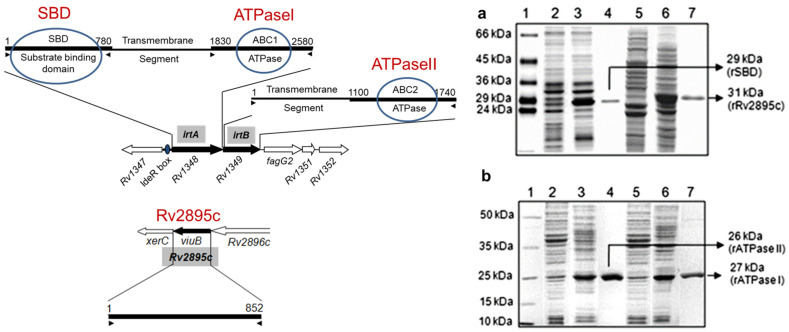
Figure 2.
Protein expression and purification. SDS PAGE analyses were carried out for the total cell lystes of E. coli BL-21 DE3 cod+ harboring (a) rSBD and rRv2895c and (b) is rATPase I, and rATPase II plasmid constructs. In both a and b, lane 1 is the protein marker. Lanes 2 and 5 are uninduced samples, lanes 3 and 6 are samples induced for 3 h, and lanes 4 and 7 are purified recombinant proteins. In (a), lanes 2–4 correspond to SBD and lanes 5–7 correspond to rRv2895c. In (b), lanes 2–4 correspond to rATPase I, and lanes 5–7 for rATPase I. The molecular size of each protein is indicated with an arrow. (Left) The panel on the left shows a schematic representation of the genes and domains on the M. tuberculosis genome (adapted from Farhana et al., 2008, ref. [12]).

