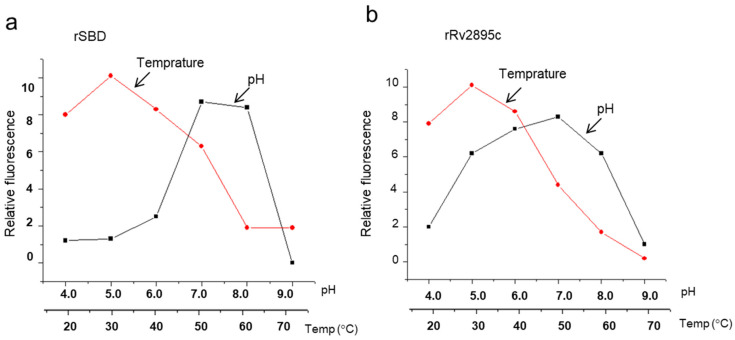
Figure 6.
pH and temperature profiling of substrate binding to SBD and Rv2895c. Fluorescence quenching, indicative of substrate binding, was evaluated across varying pH levels and temperatures for (a) SBD and (b) Rv2895c. The curves with circular data points represent the temperature dependence of substrate binding, while those with square data points illustrate pH dependence. cMyco was used as the substrate for SBD, and Fe-cMyco for Rv2895c. The graph presented is representative of three independent experiments, showing relative fluorescence (δF/F) as a function of pH or temperature.

