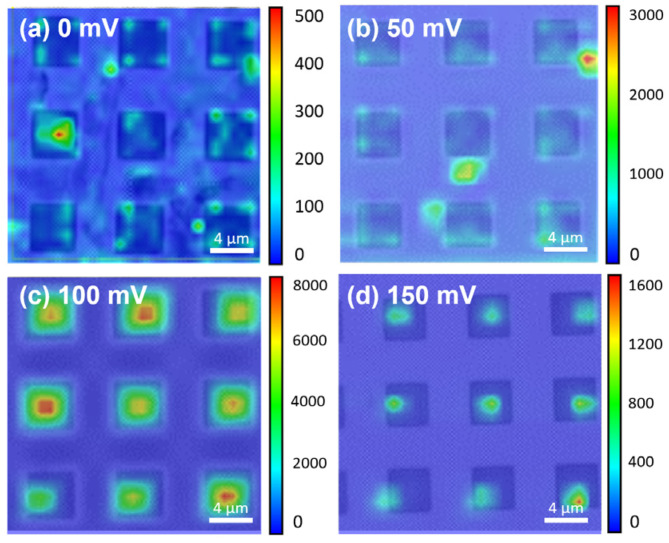
Figure 4.
Raman mapping images of R6G molecules on MoS2/patterned Si SERS substrate under applied voltages: (a) 0 mV, (b) 50 mV, (c) 100 mV, and (d) 150 mV, overlaid with corresponding OM images. The color scale represents signal intensity, ranging from blue (low) to red (high). Optimal SERS enhancement and uniform localization of R6G molecules within the pits are observed at 100 mV, whereas lower or higher voltages result in diminished signal intensity and less effective molecule aggregation.

