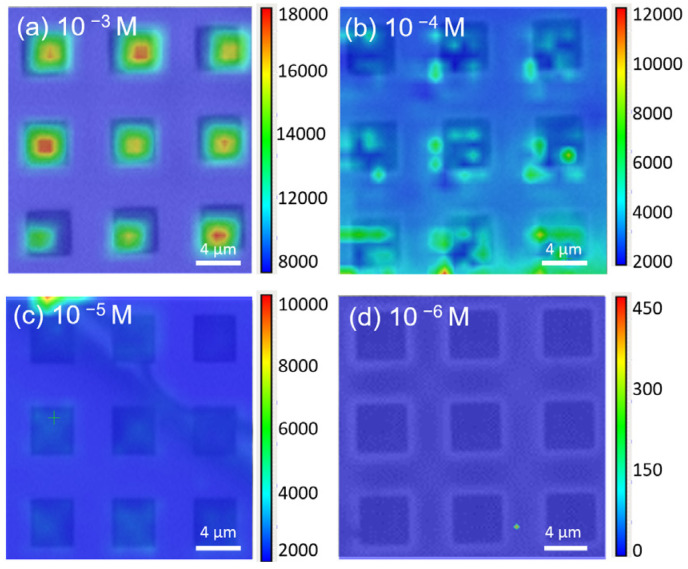
Figure 5.
Raman mapping images of R6G on MoS2/patterned Si substrate at different concentrations: (a) 10−3 M, (b) 10−4 M, (c) 10−5 M, and (d) 10−6 M, overlaid with corresponding OM images. The signal intensity decreases as the concentration reduces, with strong and uniform signals observed at higher concentrations (10−3 M), while the signals are significantly weaker at lower concentrations, indicating the detection limit around 10−5 M.

