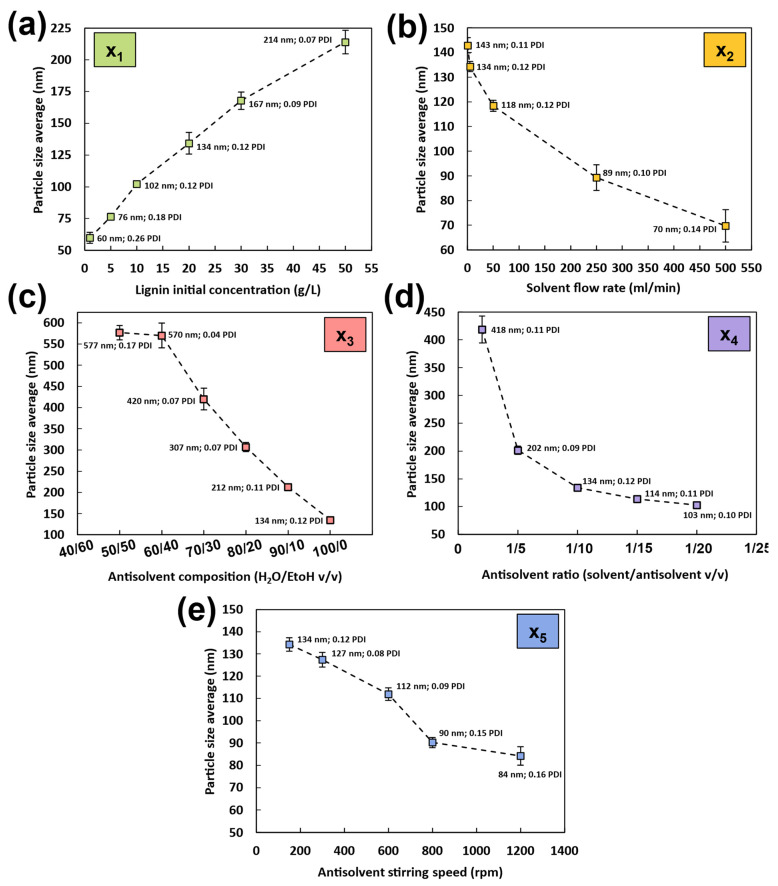
Figure 2.
Graphs from DLS show the effect of the different parameters on LNP size and polydispersity index (PDI) with (a) x1 (initial lignin concentration, g/L), (b) x2 (solvent flow rate, ml/min), (c) x3 (antisolvent composition, water/EtOH, v/v), (d) x4 (antisolvent ratio, solvent/antisolvent, v/v), and (e) x5 (antisolvent stirring speed, rpm). The precise particle size distribution from DLS is given in Figure S5. Results of the different parameters on LNPs zeta potential are given in Figure S7.

