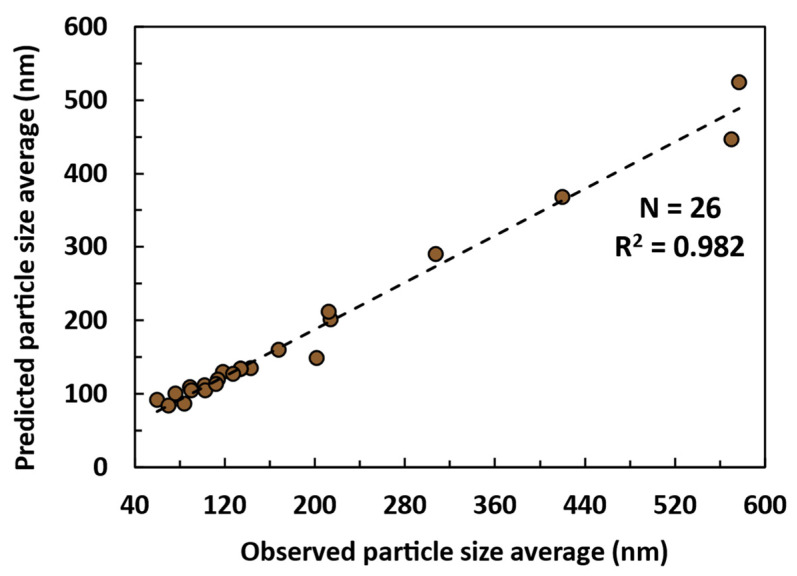
Figure 4.
Correlation between the predictive model and 26 experiments from the experimental design with the associated response (LNP size average, nm). The model considers the following factors and their alias: x1 (initial lignin concentration, g/L), x2 (solvent flow rate, ml/min), x3 (antisolvent composition, water/EtOH, v/v), x4 (antisolvent ratio, solvent/antisolvent, v/v), and x5 (antisolvent stirring speed, rpm).

