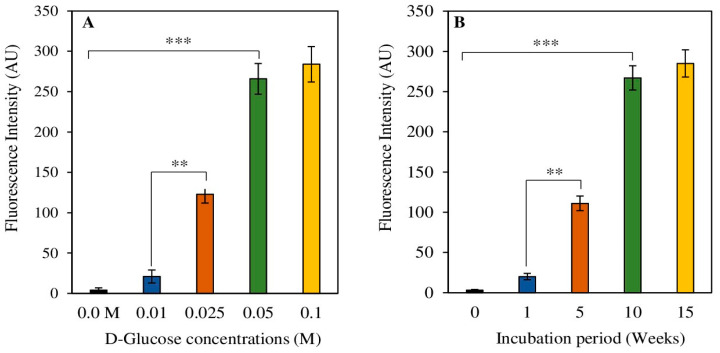
Figure 2.
Standardization of glycation reaction of protein HSA. Varying concentrations of D-Glucose (0–0.1 M) (A) and different durations (0–15 weeks) (B) of incubation periods were used in the glycation reaction. Data shown in the figures are mean ± SD values and p values represent significance. Significance changes are represented by the symbols ** and *** which mean p < 0.01 and p < 0.001, respectively.

