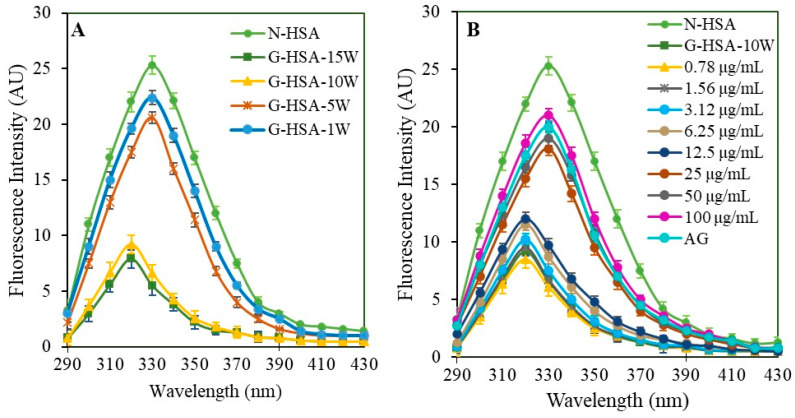
Figure 8.
Tryptophan fluorescence emission spectra. Fluorescence analysis was performed for tryptophan molecules in N-HSA, G-HSA-1W, G-HSA-5W, G-HSA-10W, and G-HSA-15W (A) samples. Change in the tryptophan microenvironment during glycation of HSA (10 weeks) with different concentrations (0.78–100 µg/mL) (B). All the samples were excited with a wavelength of 285 nm. Data shown in the figures are mean ± SD values.

