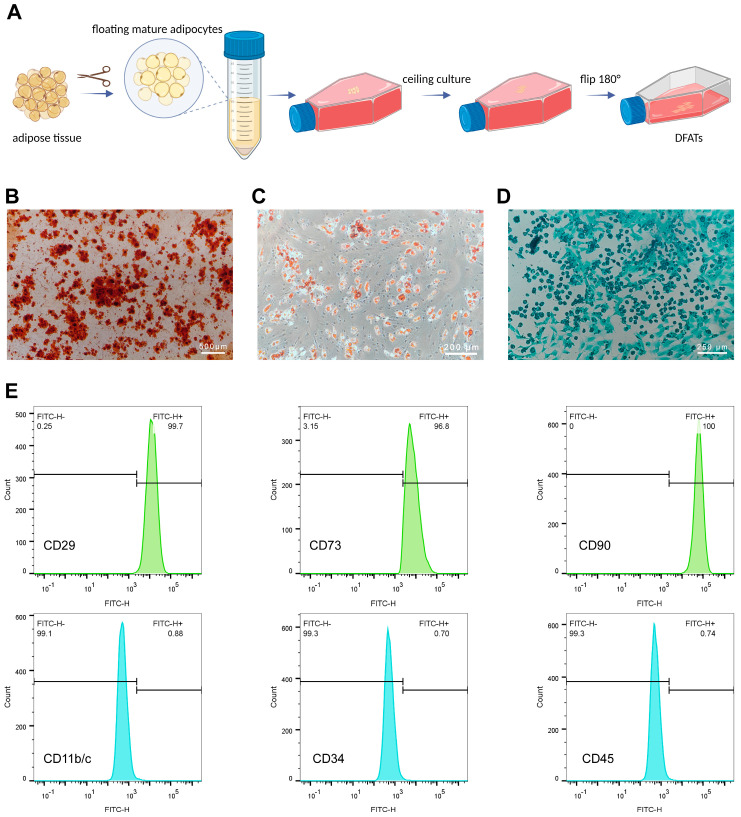
Figure 1.
Culture and characterization of DFATs. (A) Schematic diagram showing the culture of primary DFATs by “ceiling culture” method (created with BioRender.com). (B) ARS staining indicated that DFATs showed osteogenic differentiation potential, with mineralized nodules appearing orange–red. (C) Oil red O staining demonstrated that DFATs were capable of differentiating into adipocytes, with lipid droplets appearing red. (D) Alcian blue staining revealed that DFATs had chondrogenic differentiation potential, with the acidic mucopolysaccharides appearing blue–green. (E) Flow cytometry analysis of DFATs surface markers showed positive expression of mesenchymal stem cell markers CD29 (99.7%), CD73 (96.8%), and CD90 (100%). (DFATs: dedifferentiated fat cells. ARS staining: alizarin red S staining).

