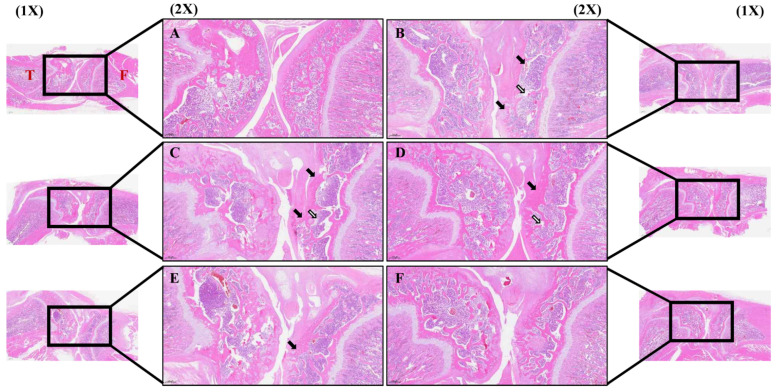
Figure 8.
The histological analysis of synovial cell changes and inflammatory cell infiltration in the knee joint tissues after treatment with PDREP in MIA-induced OA rats. Histological changes were assessed using hematoxylin and eosin (H&E) staining: (A) Normal, (B) Control, (C) PDREP 100 mg/kg, (D) PDREP 300 mg/kg, (E) PDREP 500 mg/kg, (F) MSM 300 mg/kg. Histological analysis results image magnification = 1× and 2×, and scale bar = 1000 µm and 500 μm, respectively. Square: High magnification (2×), Black arrows: articular cartilage loss, White arrows: reduced chondrocyte numbers, subchondral bone collapse. T: Tibia, F: Femur.

