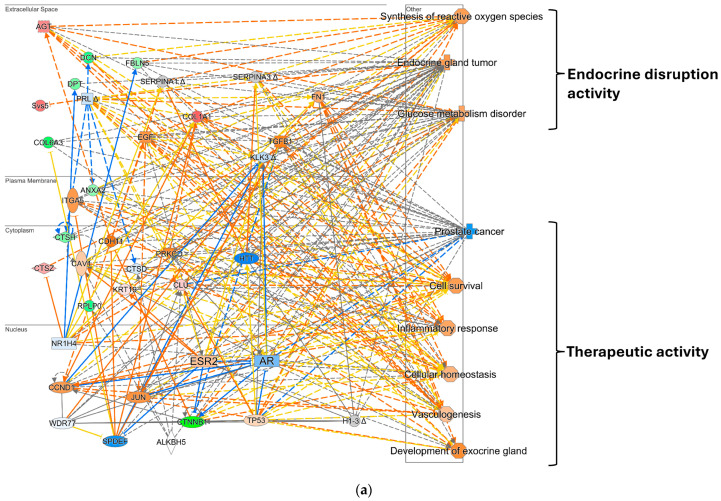
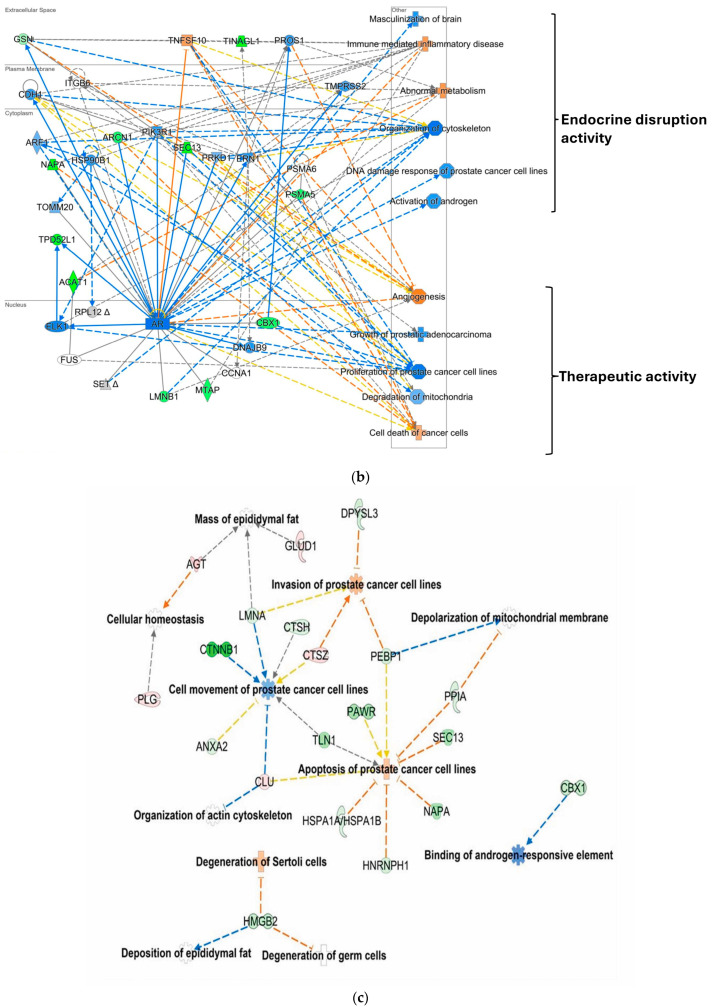
Figure 1.
IPA®-generated protein interaction networks. (a) The top network representing cellular development, growth, proliferation, and movement. (b) Another network representing cell death and survival, cellular development, cellular growth, proliferation, and mapping AR-associated protein interactions. (c) The disease and function network, depicting specific proteins and their relationship with the development of reproductive growth and disease. Red and green colors depict quantified DEPs with increased or decreased measurements, respectively. Blue and orange depict predicted activation or suppression of the process using the MAP tool, respectively. Yellow lines indicate that the finding is inconsistent with the state of the downstream molecule. The intensity of the colors represents fold change or the Z score for the prediction. Solid and dashed lines represent direct and indirect interactions, respectively.


