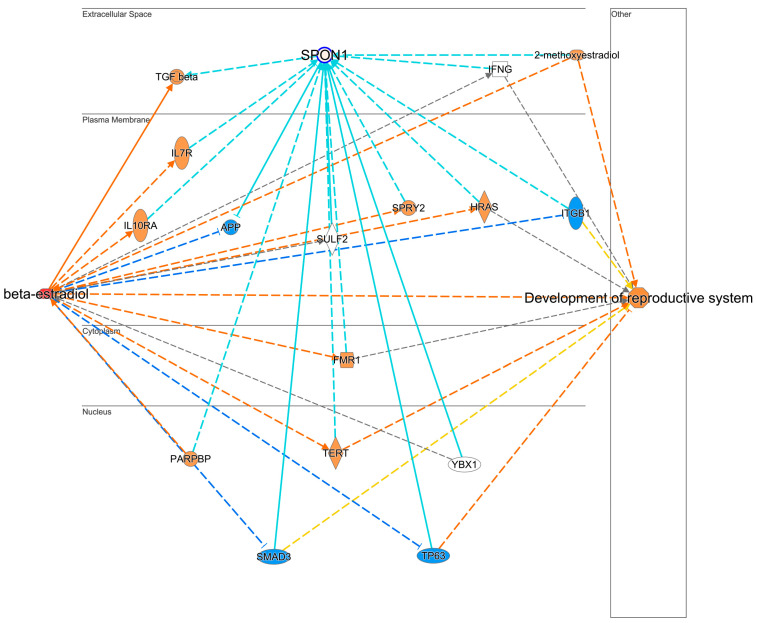
Figure 5.
Protein interaction network and impacted biological functions generated by the hypothesis-generating pathway explorer tool. The network represents interaction between E2 and CBX1. Blue and orange colors represent proteins’ predicted activation and suppression by the MAP tool of IPA, respectively. Red and green colors denote proteins which were found to increase and decrease, respectively. Teal solid and dashed lines indicate the closest relationship pattern of CBX1 with other proteins. The intensity of the colors represents fold change or the Z score for the prediction. Solid and dashed lines represent direct and indirect interactions, respectively.

