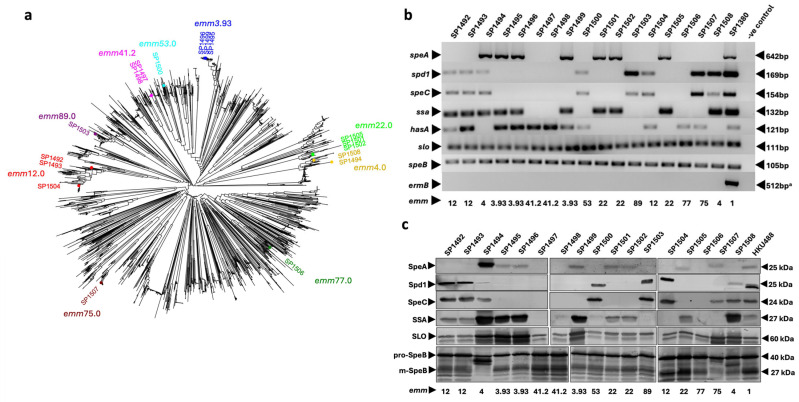
Figure 1.
Genetic analysis and protein expression of 17 GAS clinical isolates from Gold Coast University hospital. (a) Population structure of 2100 globally distributed GAS genomes [36] with addition of the 17 locally acquired GAS genomes. The tree was generated using Mashtree software v1.4.6 [37]. The 17 isolates from this study are highlighted with colours matching the respective emm type. (b) PCR screening for toxin and antibiotic resistance genes. Genes examined are indicated on the left, and PCR product sizes (bp) are indicated on the right. M1UK GAS isolate SP1380 was used as a positive control for all toxins [31]. a emm12 GAS isolate HKU16 was used as a positive control for ermB [23]. (c) Western blot analysis of toxin expression in culture supernatants. Toxins are indicated on the left, and the protein mass (kDa) is indicated on the right. M1global GAS isolate HKU488 was used as a positive control. The slightly lower molecular weight band detected for SLO likely represents an SLO isoform or breakdown product [43].

