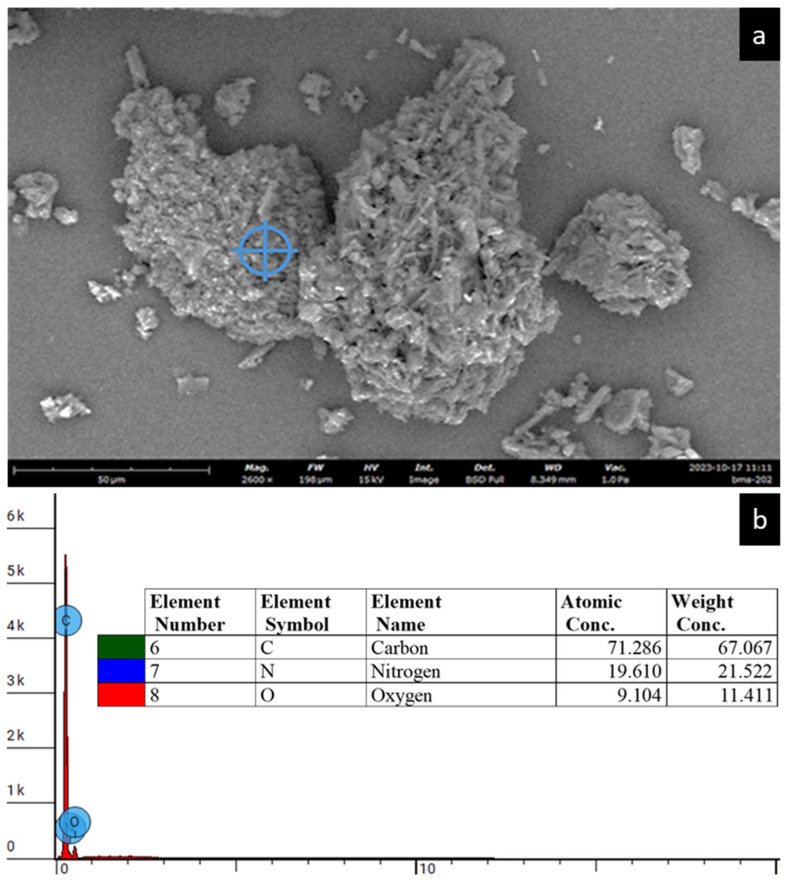
Figure 3.
(a) Representative SEM micrograph taken at 2400× magnification, depicting the elemental spot analysis of the BMS-202 particle surface using EDX spectroscopy. (b) Representative EDX spectrum of the analyzed spot on the powder sample, indicated by the blue crosshair, illustrating the elemental composition of the BMS-202 particle, comprising C, N and O (with the N symbol overlapped by the O symbol). The inset table presents the atomic and weight concentrations of the identified elements.

