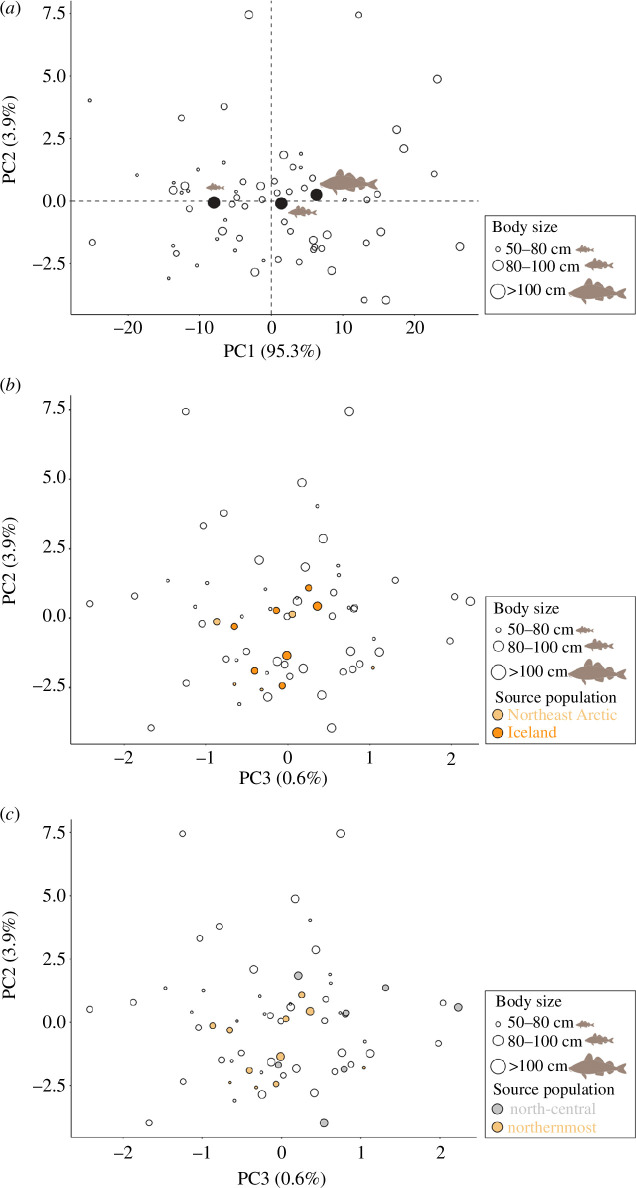
Figure 3.
Principal component analysis (PCA) for carbon (δ13C), nitrogen (δ15N), non-exchangeable hydrogen (δ2H) and sulphur (δ34S) isotope values, highlighting (a) body size and (b) putative genetically inferred source population assignments of individuals to the Northeast Arctic (NEA) or Iceland populations and (c) north-central or northernmost genomic groups. Values distributed across the PC1–PC2 axes explain 99.18% of the observed variations, while values across the PC2–PC3 axes explain 4.5% of the observed variation. The means (black dots) of each particular body size class (grey cod silhouette) are sorted smallest to largest along PC1s.

