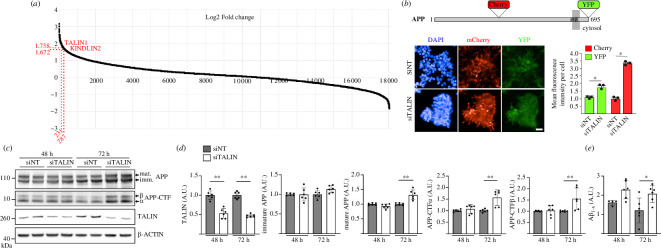
Figure 5.
Talin1 depletion dramatically alters APP processing in cells. (a) The published data set from [40], shows the distribution of modulation (log2 fold change) of APP metabolism on genome-wide siRNA screening. The log2 fold change for talin1 (1.74) and kindlin2 (1.67) are shown. (b) Schematic representation of APP, showing where the fluorescent proteins (mCherry and YFP) are inserted for the high-content siRNA screen (HCS). Representative fluorescence microscopy images and quantification showing the impact of talin1 silencing on mCherry and YFP intensity based on HCS data. Scale bar = 20 µm. Graphs represent variations of the mean fluorescence intensity per cell (n > 300) observed after transfection of HEK293-APPmcherry-YFP with siRNA targeting Talin1 (siTalin1) when compared with non-targeting (siNT) siRNA, in three independent experiments. (c,d) Impact of talin1 silencing on APP metabolism in the HEK293-APP695WT cell line. (c) Cells transiently transfected with siTalin1 or siNT were analysed by Western Blot (WB) using anti-APP C-terminal, anti-talin1 or anti-actin antibodies. (d) Densitometric analyses and WB quantifications from three independent experiments are shown. Mature APP, immature APP, C-terminal fragments (APP-CTF) α and β. (e) Aβ1−X secreted into the conditioned medium were assayed using an AlphaLISA. Histograms indicate the mean ± s.d. A.U., arbitrary units. *p < 0.05, **p < 0.00.1 Mann–Whitney non-parametric test.

