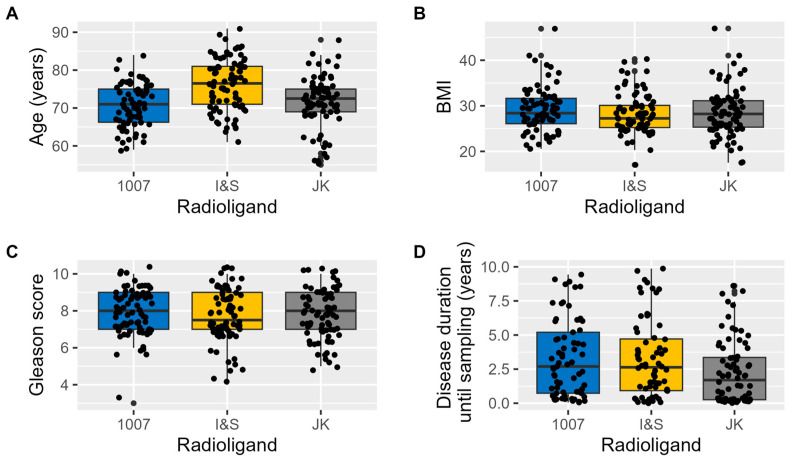
Figure 1.
Basic clinical parameters of the radioligand patient groups. The boxplots illustrate the distribution of key clinical variables across patient groups examined with different radioligands. (A) shows the distribution of Age, (B) displays BMI, (C) depicts the Gleason score, and (D) represents Disease duration until imaging.

