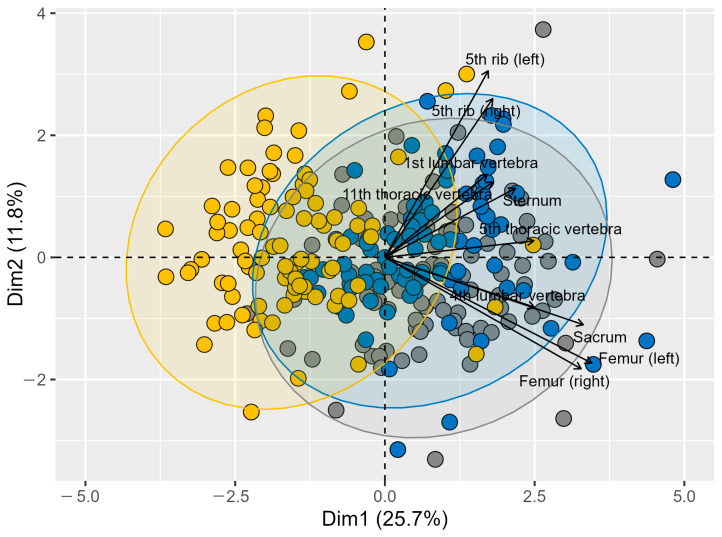
Figure A1.
PCA biplot visualizing the relationships among skeletal VOIs based on their CV values. Different colors represent the three radioligands, and arrows indicate the direction and magnitude of the VOI contributions to the principal components. The length of each vector signifies the importance of the corresponding VOI in the PCA, with longer vectors indicating a greater contribution to the overall variance. Vectors pointing in similar directions suggest similar patterns of variation among VOIs.

