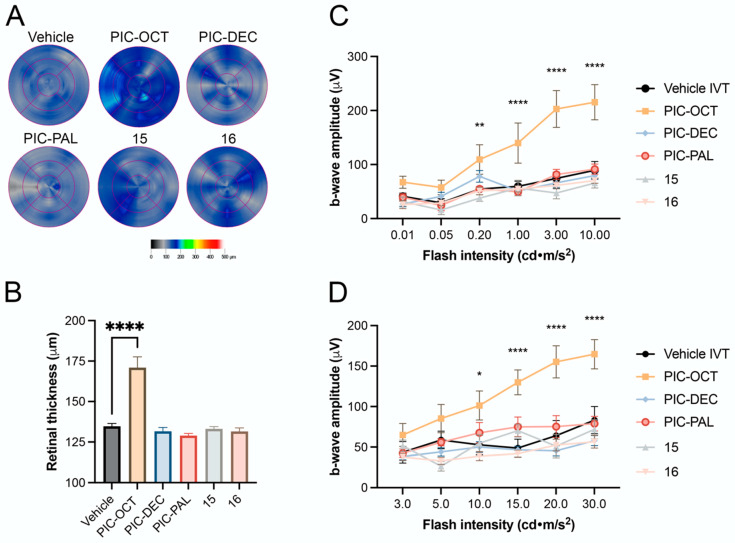
Figure 8.
Effect of PIC-OCT and different acyl chain length and carbohydrate position on the rd10 mouse retinas. Retinal maps obtained by optical coherence tomography (OCT) scans of rd10 mice or treated with 5% DMSO (vehicle), or piceid octanoate (PIC-OCT), and compounds PIC-DEC, PIC-PAL 15 and 16 (A). Representative images of each group are shown. The colorimetric scale represents the retinal thickness in µm. Six radial scans were measured to construct the retinal maps. The graphs represent the mean ± SEM of retinal thickness (B), b-wave amplitude in dark-adapted (C) and light-adapted conditions (D). The parametric one-way ANOVA (B) or two-way ANOVA (C,D) test followed by Dunnett’s multiple comparisons test evaluated statistically significant differences between the vehicle and each of the other groups. A p-value less than 0.05 was considered statistically significant. * p < 0.05; ** p < 0.01; **** p < 0.0001.

