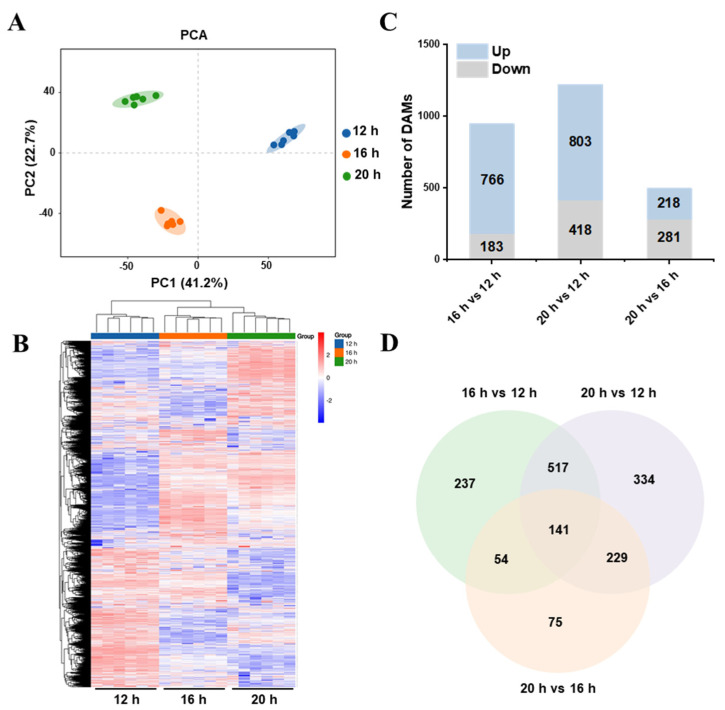
Figure 8.
Metabolome analysis of tomato seedlings under different photoperiods. (A) Principal component analysis (PCA) of metabolites under three different photoperiods. Circles represent 95% confidence intervals. (B) Cluster heat map of relative metabolite content in tomato plants under three different photoperiods. (C) The total number of upregulated and downregulated differentially accumulated metabolites (DAMs) in the different groups. (D) Venn diagram of the DAMs under three different photoperiods.

