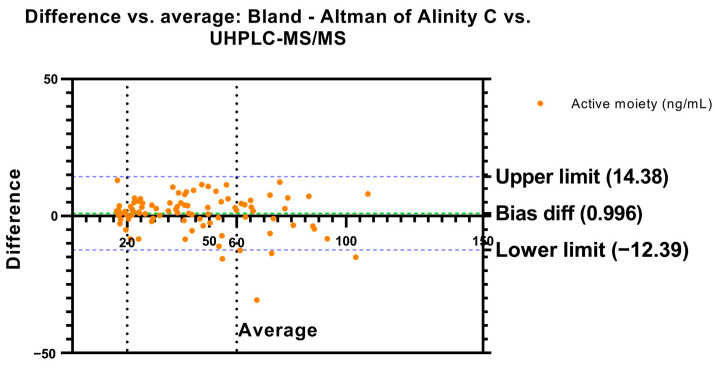
Figure 1.
Bland–Altman’s plot. Difference in active moiety concentrations (risperidone plus paliperidone) vs. the average between Alinity C and UHPLC-MS/MS. Dashed green line represents the bias difference and dashed blue lines represent the limits of agreement. Risperidone therapeutic reference range is represented by dashed black lines.

