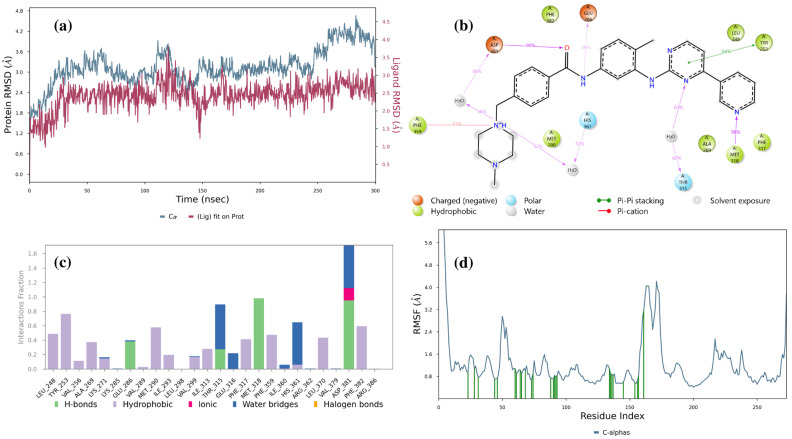
Figure 7.
Result of 300 ns MD analysis for imatinib binding to the Abl-kinase domain. The protein–ligand RMSD plot of imatinib bound to the Abl-kinase domain (a) (PDB ID: 1IEP). Ligand–protein contact interactions scheme with the protein residues of imatinib bound to Abl-kinase (b). Protein–ligand contacts histogram of the interaction fraction of H-bond (green), hydrophobic bond (purple), ionic bond (magenta), and water bridges (blue) for imatinib (c). RMSF plot of imatinib (d) protein–ligand complex.

