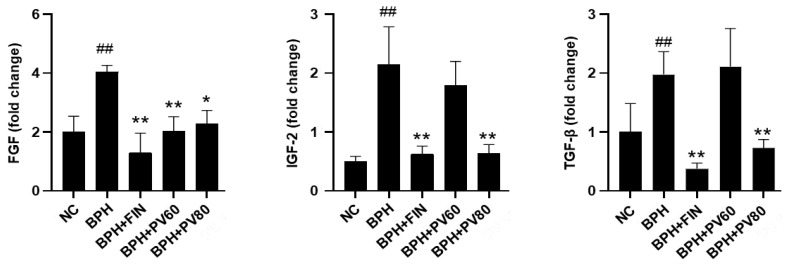
Figure 6.
Effects of PV extract on growth factor expression levels in a rat BPH model. The prostatic mRNA levels of FGF, IGF-2, and TGF-β. NC, PBS- and corn oil-dispensed rats; BPH, PBS- and testosterone-dispensed rats; BPH + FIN, testosterone- and finasteride-dispensed rats; BPH + PV60, testosterone- and PV 60 mg/kg-dispensed rats; BPH + PV80, testosterone- and PV 80 mg/kg-dispensed rats. Representation of results as average ± SD. Comparison ## p < 0.01 with the NC group; comparison * p < 0.05 and ** p < 0.01 with the BPH group.

