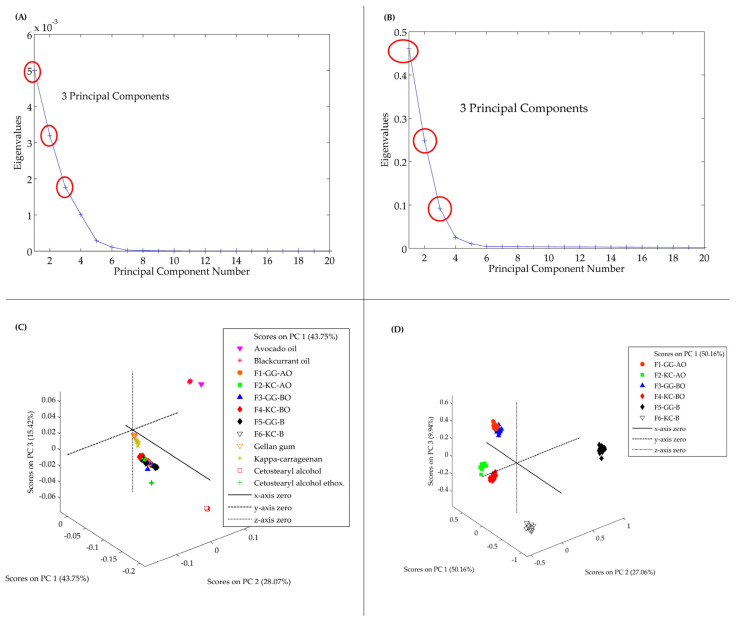
Figure 4.
PCA model. In (A,B) are the eigenvalues graphs, which indicate that these three principal components encompass most of the chemical information in the raw materials. The red circles represent the principal components selected for the model. In (C,D) are the score plot graphs that reveal a distinct differentiation is observable between the formulations containing GG and KC, emphasizing these polysaccharides’ influence on the formulations’ ultimate chemical composition.

