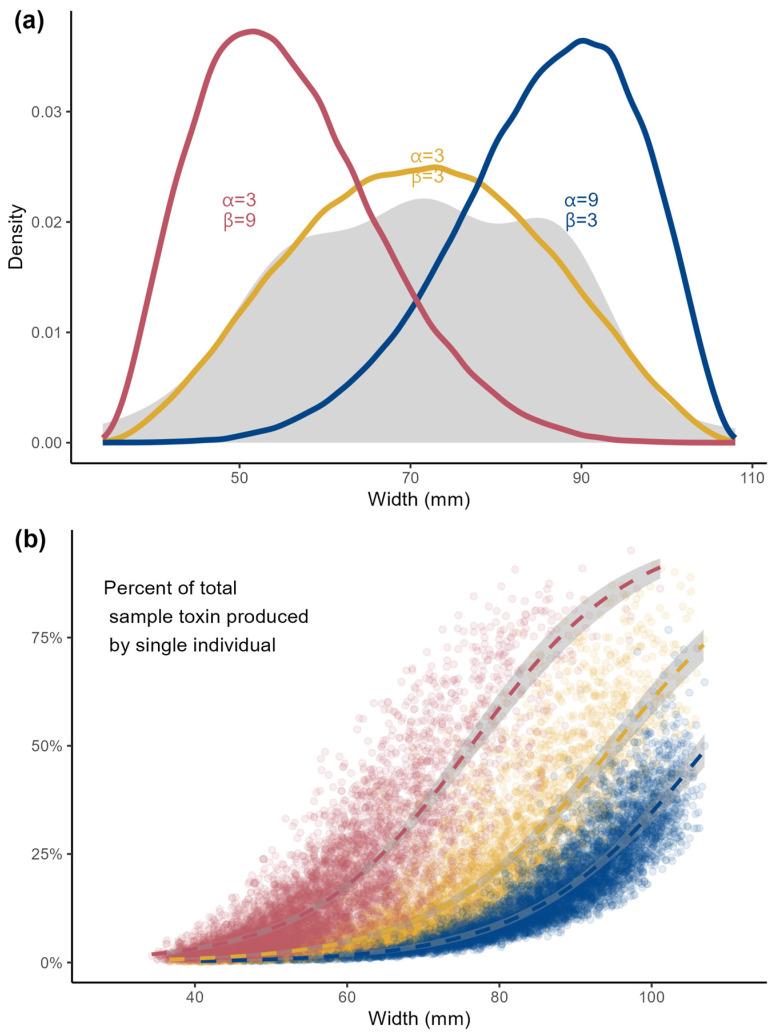
Figure 4.
(a) Density functions of simulated β distributions (colored lines) and observed density function for butter clam shell width (gray shaded region) for this study, (b) percent of total toxicity of a 6-clam homogenate contributed by a single clam as a function of width (n = 1000 simulations for each distribution). Smooth curves are binomial logistic regression models for each distribution type, and shaded regions represent confidence intervals.

