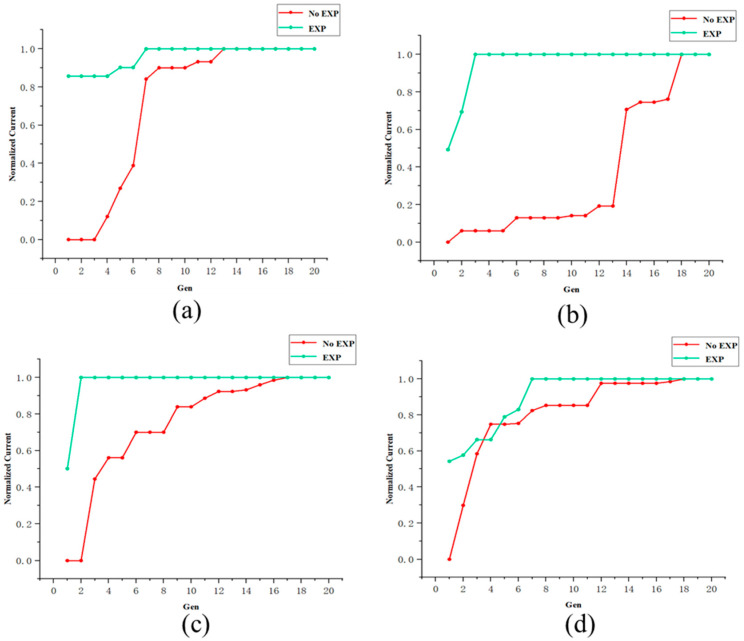
Figure 11.
Optimization process of four groups of online tests. The horizontal axis represents the current evolutionary iteration, and the vertical axis represents the current intensity after normalization. The red curve represents the results under the random initial state, while the green curve represents the results when invoking the prior experience. (a) The optimized objects are Slit2-X1, X2, Z1, Z2. (b) The optimized objects are DMM-Roll. (c) The optimized objects are DMM-Pitch, Roll-, PFM-m1, and m2. (d) The optimized objects are DMM-Pitch and Roll.

