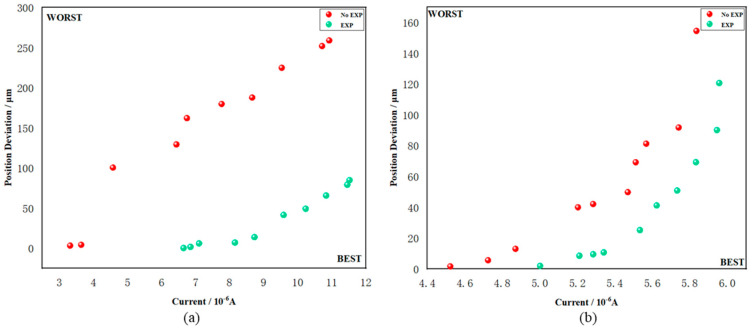
Figure 12.
Optimization process of four groups of online testing. The horizontal axis represents the flux intensity, while the vertical axis represents the degree of deviation between the spot position and the central light cone. Each point in the figure represents an equivalent Pareto solution, with the red point indicating the result under the random initial state, and the green point representing the result under experience. (a) The optimized objects are Slit2-X1, X2, Z1, and Z2. (b) The optimized objects are DMM-Pitch and Roll.

