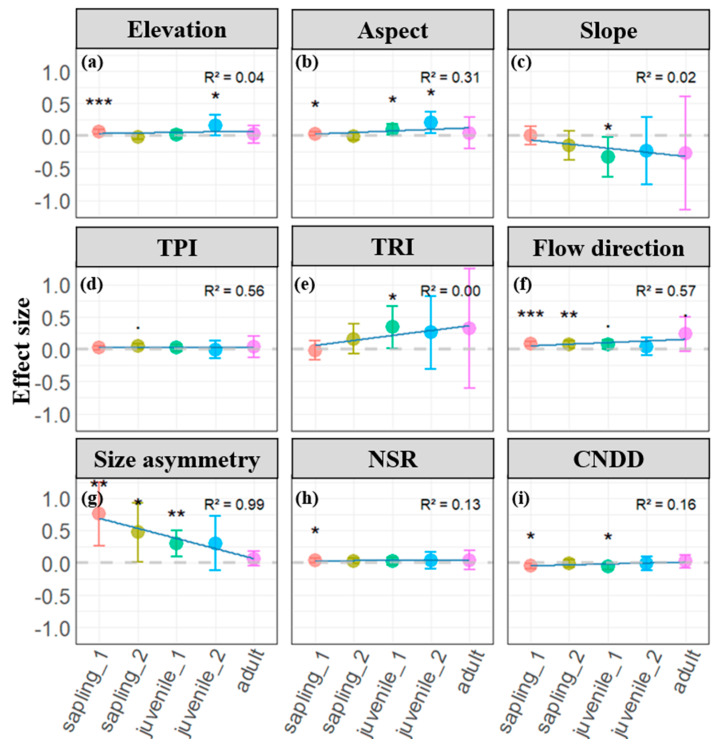
Figure 2.
Parameter estimates of microtopographic (a–f) and neighborhood effects (g–i) on individual tree survival across different life history stage. Dots represent estimated coefficients with error bars depicting standard errors. Positive coefficients indicate positive effects, while negative coefficients indicate negative effects. Significance levels: • p < 0.1; * p < 0.05; ** p < 0.01; *** p < 0.001. In the inset figure, R-squared values represent the regression coefficient for changes across life stages, and light blue lines illustrate the trend of neighborhood effects across life stages.

