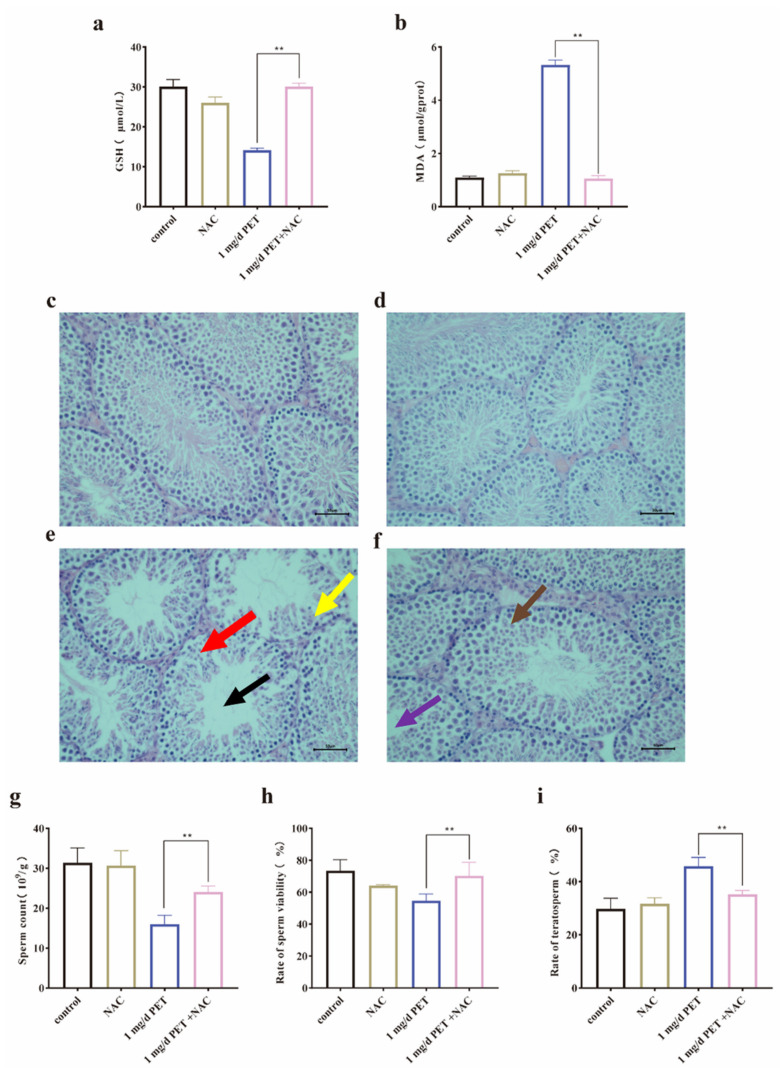
Figure 7.
The pathological changes in the testicular tissue of mice after NAC antagonism. (a) GSH levels; (b) MDA levels; (c) control group; (d) NAC-treated group; (e) 1 mg/d PET MP group; (f) NAC intervention group; (g) sperm count levels; (h) sperm viability rate; and (i) teratosperm rate. The black arrow indicates that the spermatogenic tubule was empty. The red arrow indicates a disorder of the spermatogenic epithelium. The yellow arrow indicates a decrease in spermatogenic cells. The purple arrow indicates that the spermatogenic tubules are partially restored. The brown arrow indicates that the spermatogenic cells gradually recovered. Scale bar: 50 µm. n = 5 for all groups. Data are presented as the mean ± SEM. ** indicates p < 0.01 (compared with the control group).

