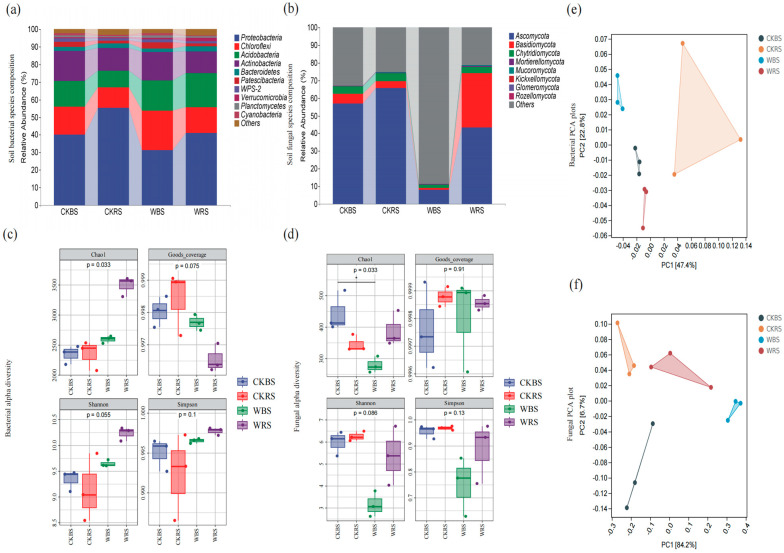
Figure 2.
Changes in microbial diversity following treatment with phosphate-solubilizing bacteria in T. grandis. Panels (a,b) show the composition of bacterial and fungal communities, respectively, while (c,d) display the alpha diversity of these communities. Panels (e,f) present the principal component analysis (PCA) plots for bacteria and fungi, respectively. In Figures (a,b), the horizontal axis represents the four subgroups (CKBS, CKRS, WBS, WRS), and the vertical axis reflects the abundance of species at the genus level. The length of the bars corresponds to species abundance. The box plots in Figures (c,d) depict Chao1, which indicates total species richness, while the Simpson and Shannon indices measure microbial diversity within the soil samples. Good’s coverage reflects sample coverage. The p-value atop the box plot indicates the statistical significance of diversity index differences among the subgroups.

