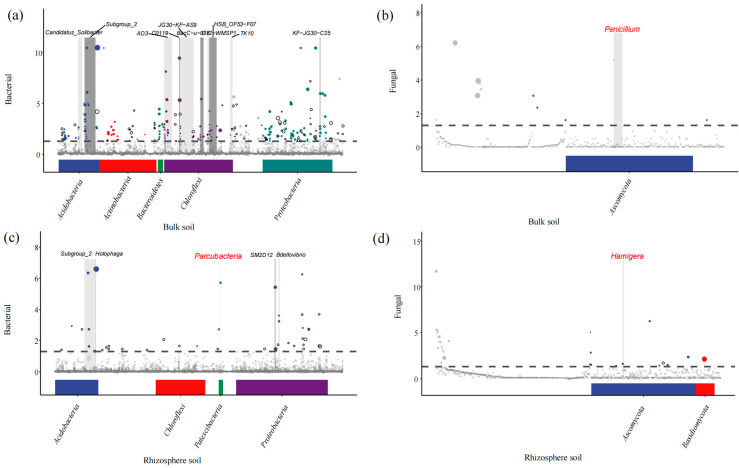
Figure 3.
Species-level changes in soil microorganisms across different groups. (a) Bacterial changes in the bulk soil. (b) Fungal changes in the bulk soil. (c) Bacterial changes in the rhizosphere soil. (d) Fungal changes in the rhizosphere soil. The horizontal axis represents the ASVs, organized according to their taxonomic information from phylum to species, while the vertical axis reflects the −log10(adj-Pvalue) values. Each dot or circle represents an ASV, with its size indicating relative abundance, expressed in log2(CPM/n). The dotted line represents significance analysis. Microorganisms below the dotted line are not significant. The symbols above the dotted line are significant. A grayscale background highlights the top 10 genera with the most significantly upregulated points (default setting), and the genus name is labeled at the top of the figure.

