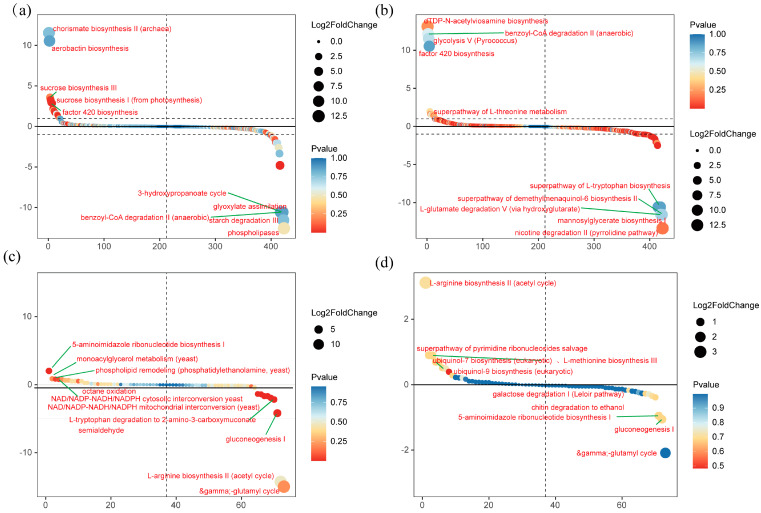
Figure 4.
Microbial functional prediction analysis. Functional predictions for bacterial communities in bulk (a) and rhizosphere (b) soils, and fungal communities in bulk (c) and rhizosphere (d) soils. The vertical axis reflects the degree of upregulation (positive) or downregulation (negative) following inoculation. The colored dots indicate the significance of pathway changes (represented as the −log10 of the p-value), while the size of the dots corresponds to the extent of fold changes (represented as the log2 of the fold change).

