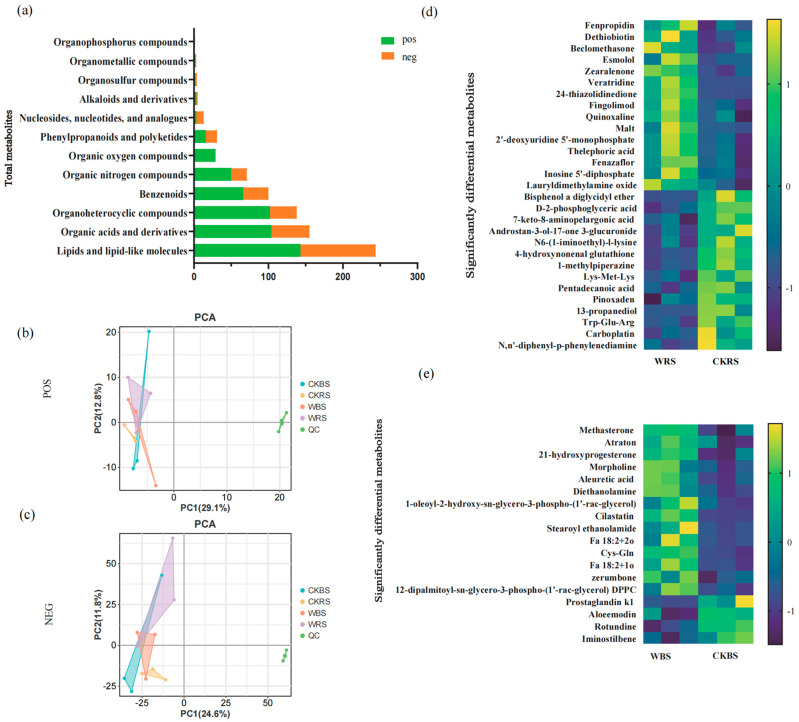
Figure 5.
Analysis of significantly differential metabolites in soil. (a) Total metabolites identified across all soil samples. PCA of metabolites in positive-ion mode (POS) (b) and negative-ion mode (NEG). (c) The clustering of three samples in the same group indicates good reproducibility. A heatmap displaying significant differences in soil metabolites for POS (d) and NEG (e). The vertical axis lists the significantly different metabolites, while the horizontal axis shows the different groups. Yellow indicates elevated expression levels of significantly different metabolites, and blue indicates reduced expression levels. WBS and WRS represent treatment groups, while CKBS and CKRS serve as control groups.

