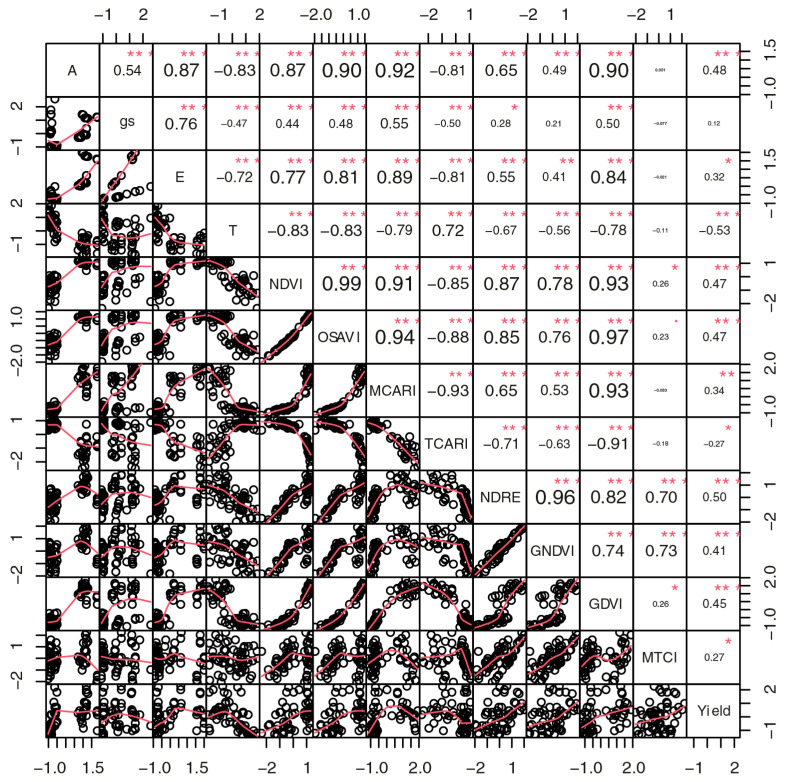
Figure 7.
Correlogram of Pearson’s correlation between vegetation indices and leaf gas exchange in 2019. A: photosynthesis, gs: stomatal conductance, E: transpiration and T: canopy temperature °C. Values close to 1 indicate a strong positive correlation, while values close to −1 represent a strong negative correlation. Values close to 0 suggest an absence of significant linear relationship. In addition, the size of the source observed in the corelogram was used to graphically represent the magnitude of the correlation, allowing a clear visualization of the strength of the associations. Stronger correlations (positive or negative) were highlighted with larger font size and bold, while weaker correlations were presented with smaller and unbold fonts. The statistical significance of the correlations was evaluated at a probability level: * significant at p < 0.05, ** significant at p < 0.01, *** significant at p < 0.001.

