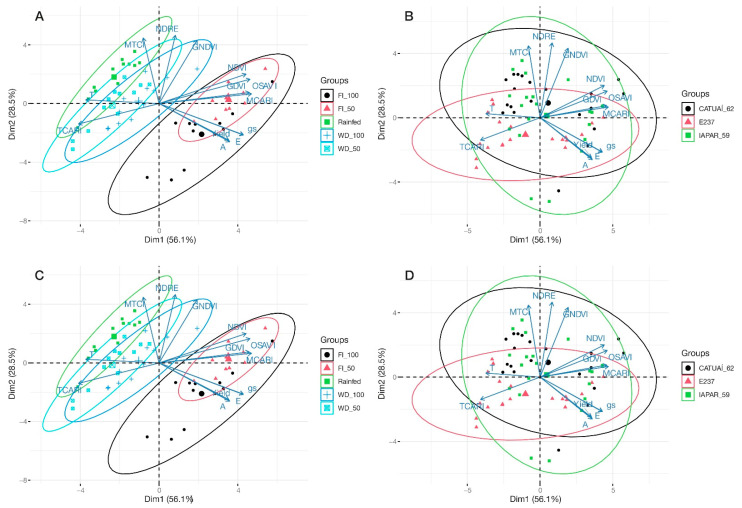
Figure 9.
Exploratory analysis of the principal components for vegetation indices and coffee tree physiology and productivity in response to different water regimes and of different genotypes in the growing seasons of 2019 (A,B) and 2020 (C,D). The vectors of the variables projected onto the graphs indicate the magnitude and direction of their contribution to the separation between groups. The length of the vectors reflects the intensity of their influence on the principal components, while their orientation highlights the multivariate differences between the evaluated conditions. The ellipses drawn around the experimental groups represent the intragroup dispersion based on the covariance of the data. The center of each ellipse corresponds to the centroid of the respective group, representing the average position of the observations. The orientation and size of the ellipses indicate the internal variability of each group: more compact ellipses suggest greater homogeneity within the observations. In contrast, larger ellipses indicate greater heterogeneity, possibly associated with the different conditions imposed by the treatments. The distribution of the vectors and the separation of the ellipses demonstrate that the analyzed variables play a significant role in differentiating between the groups of cultivars and irrigation regimes, providing insights into the physiological and spectral responses under each evaluated scenario.

